To further enhance the understanding of crop health and growth, I expanded the pipeline to incorporate canopy height and canopy thermal data. These additional dimensions could provide valuable insights into plant development and stress responses.
Canopy Height
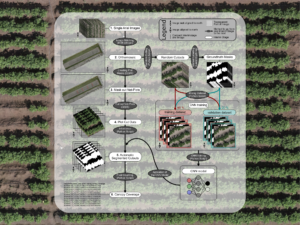
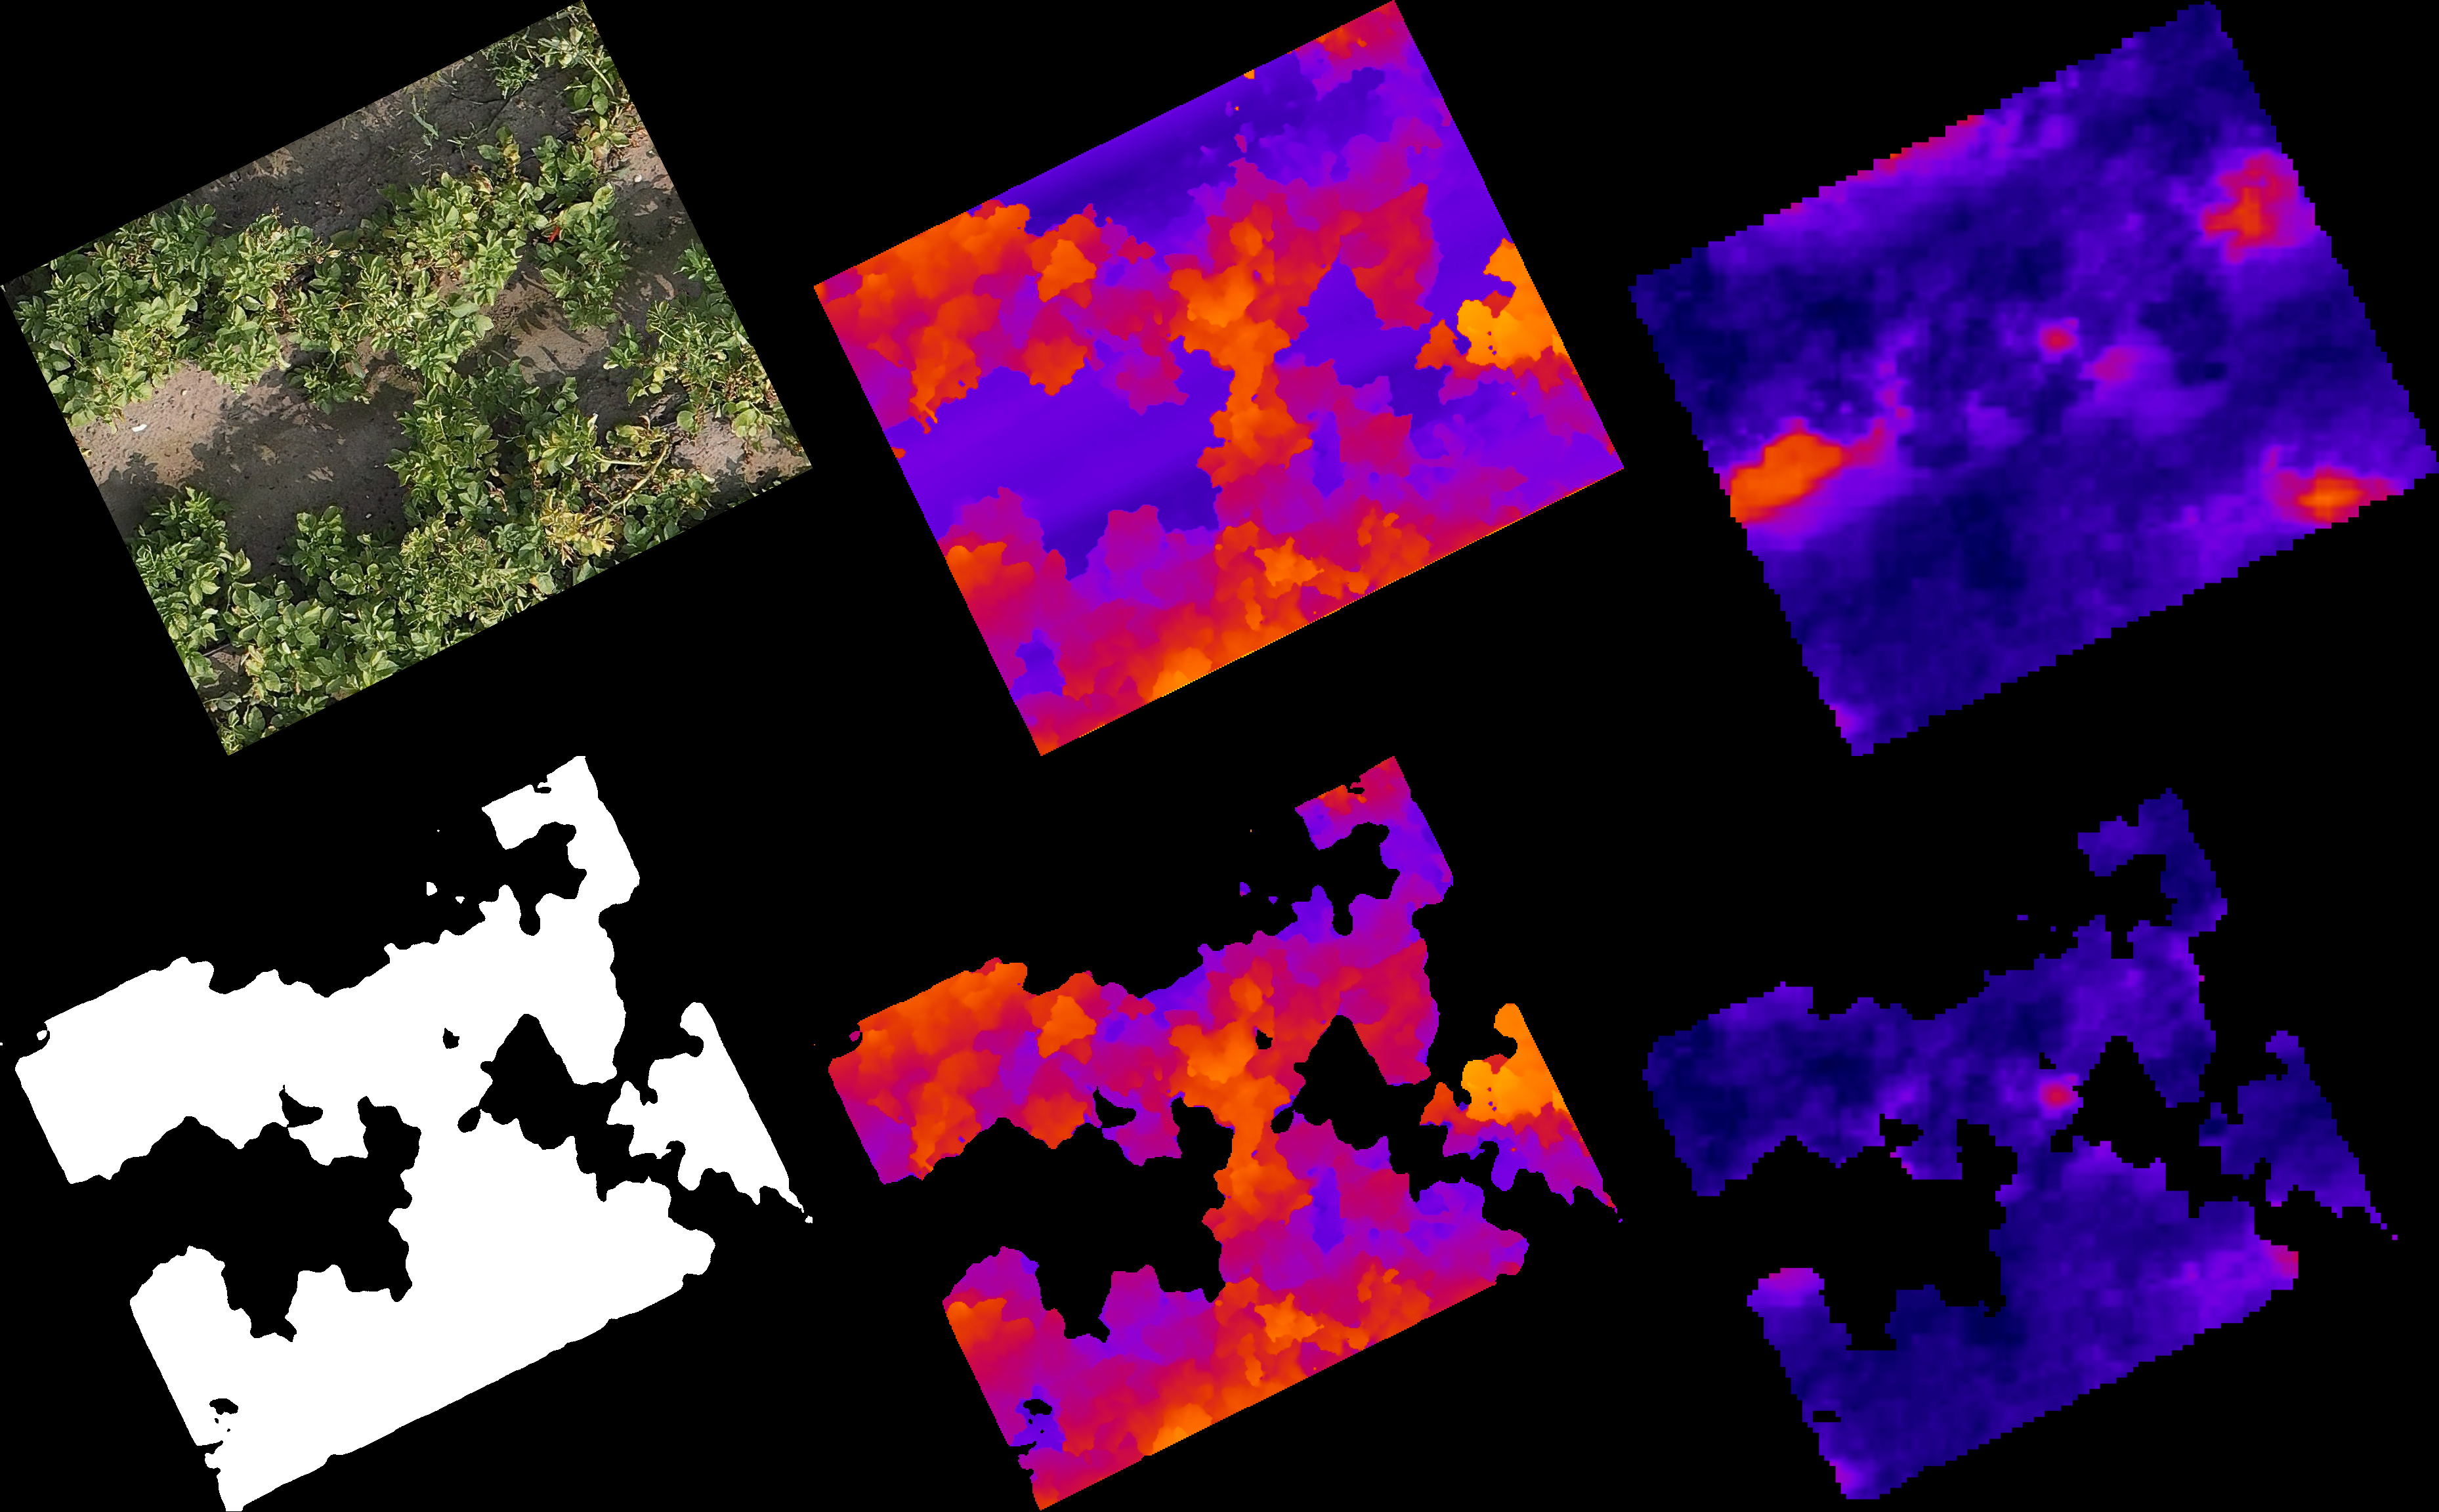
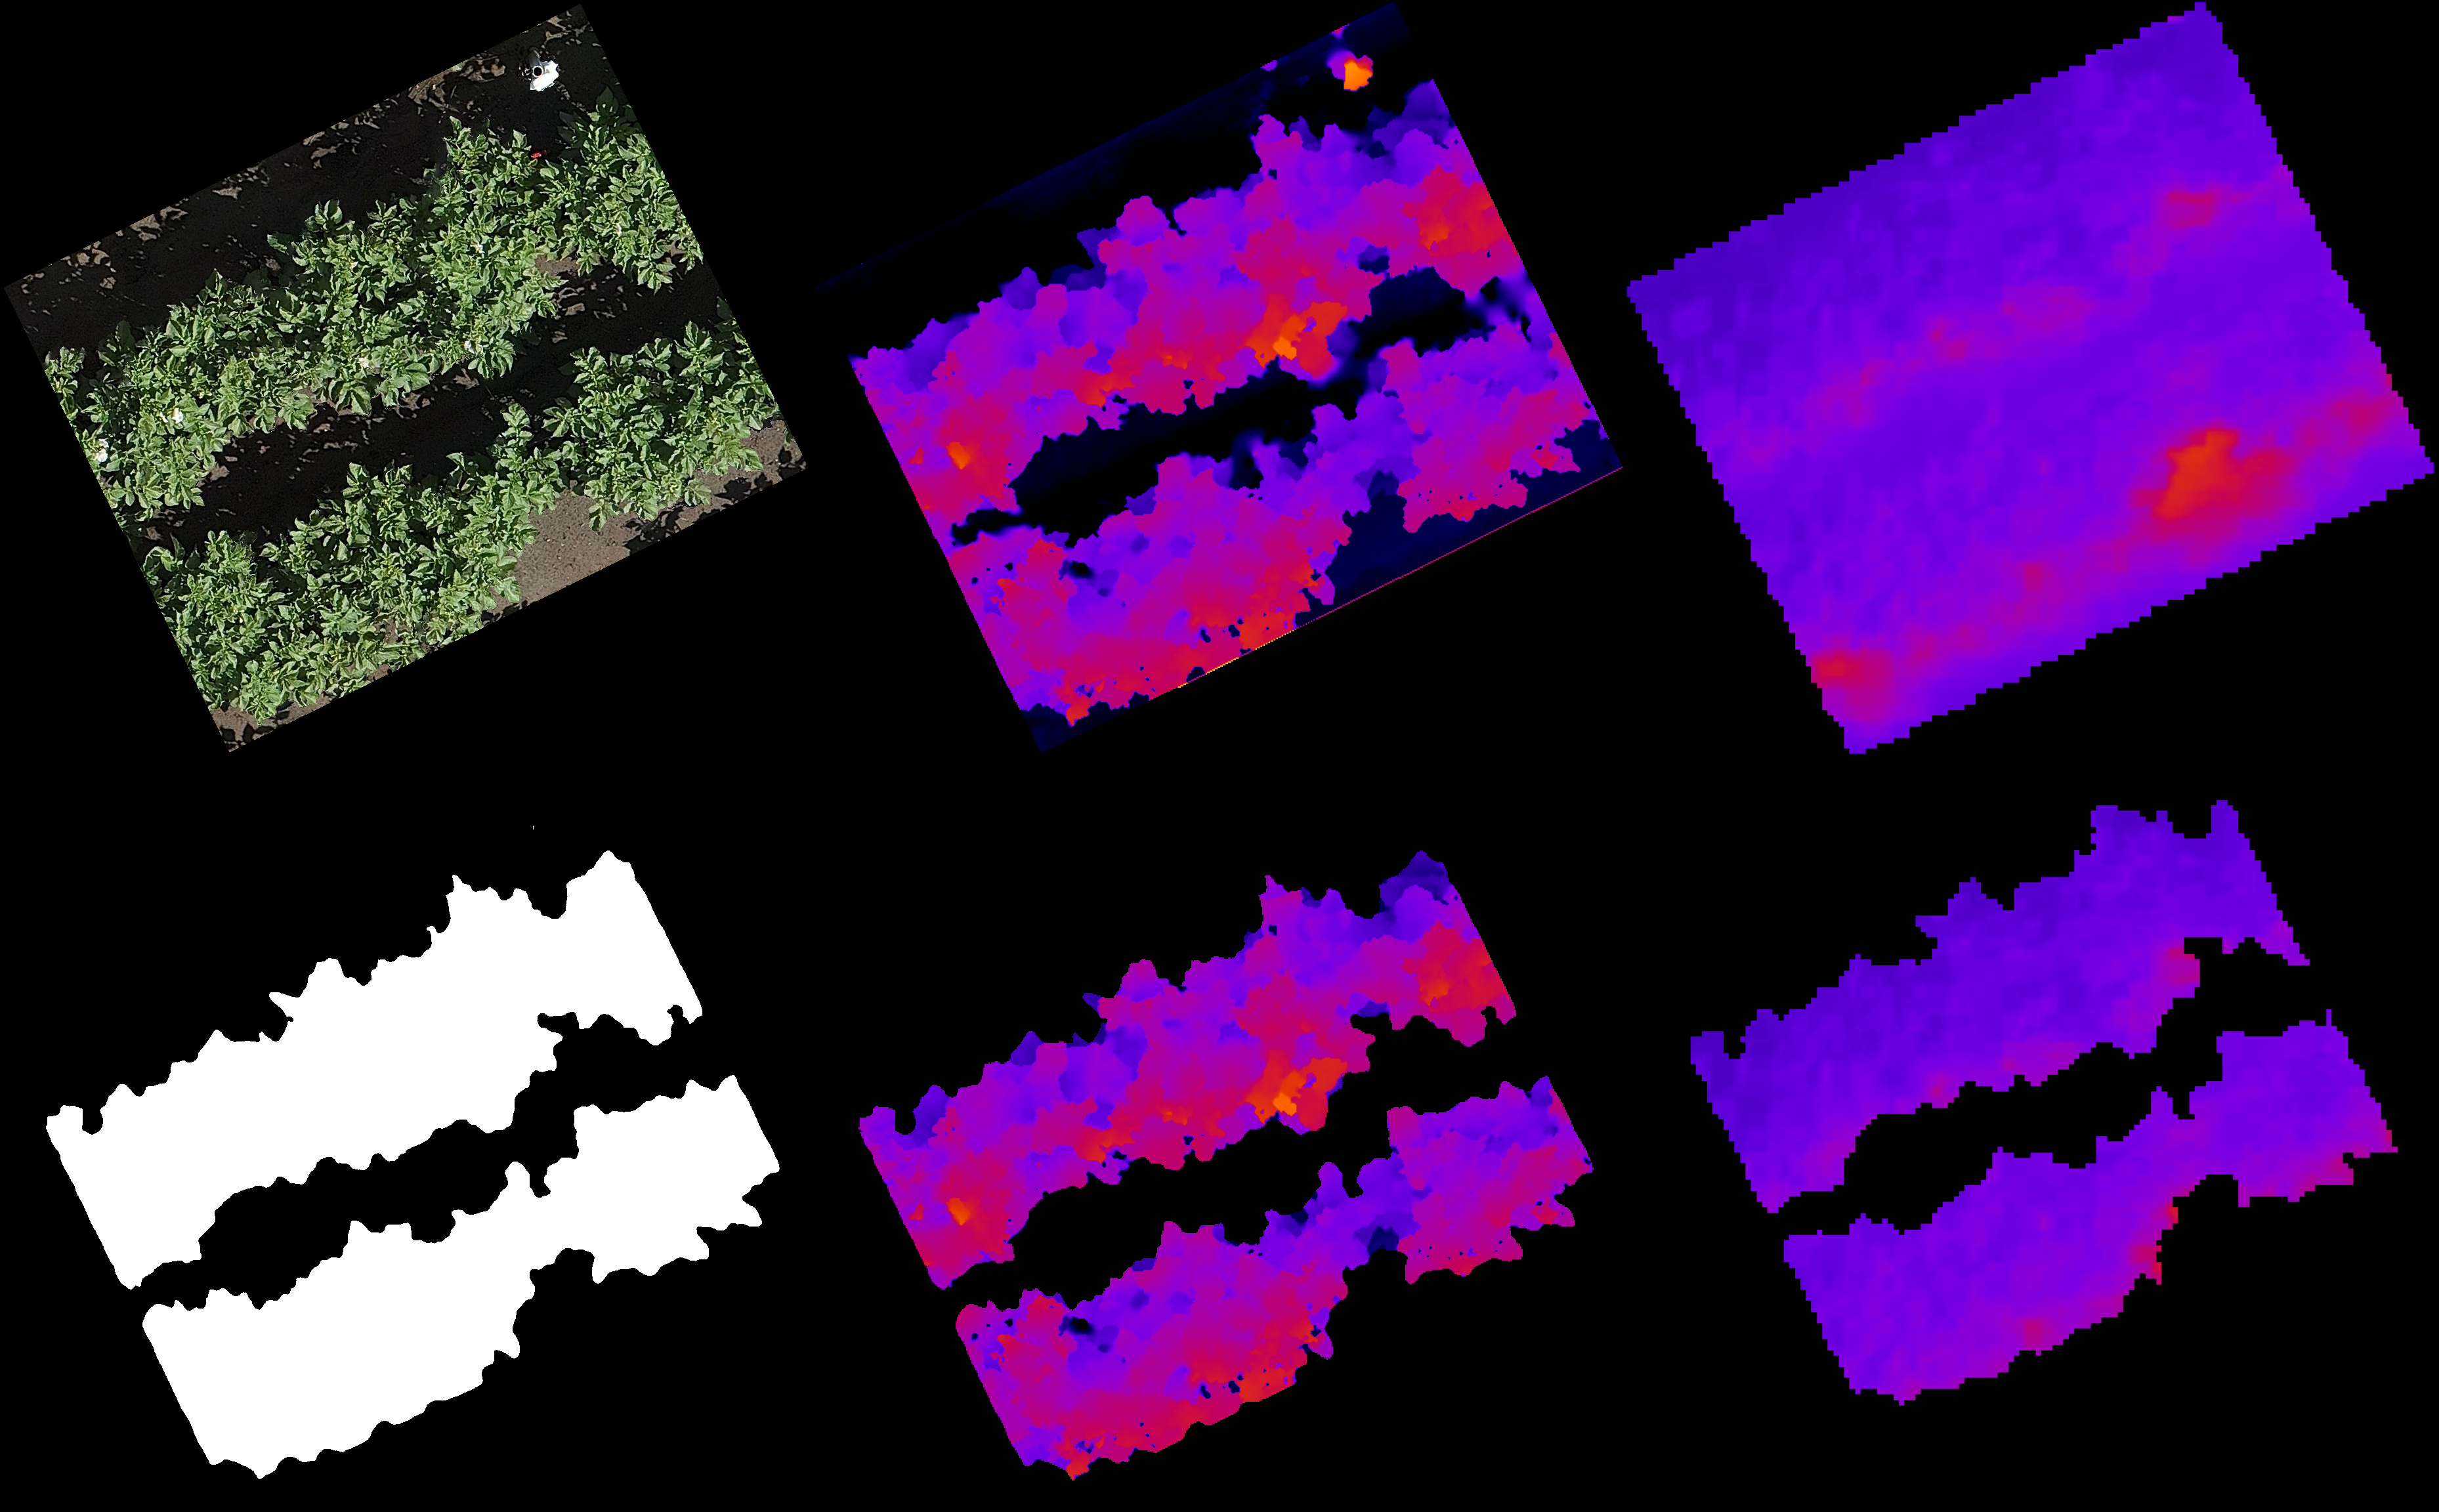
To estimate canopy height, I utilized the digital elevation map (DEM) functionality within Agisoft Metashape. This generated an orthomosaic from the RGB images (see former post) where pixel values represented relative height. To convert these relative heights to absolute values, a multiple ground control points (GCPs) at fixed locations within the field were established. By measuring the height at these GCPs manualy and correlating them with corresponding points in the relative height orthomosaic, I was able to fit a linear regression model. This model allowed to convert the relative heights to absolute heights across the entire orthomosaic.
After converting to absolute heights, the previously generated plot masks (see former post) were applied to isolate individual plots. To ensure accurate height measurements, I excluded soil pixels using the CNN-derived canopy masks (see former post). To account for the uneven terrain of potato ridges, a pre-emergence height image (averaged along the ridge direction) was subtracted from the absolute height image. The average pixel value within the resulting image represented the average canopy height above ground for each plot at each image acquisition date.
Canopy Temperature
Canopy temperature was measured using a UAV-based FLIR thermal sensor. Thermal images were processed in Agisoft Metashape to generate a thermal orthomosaic, where pixel values represented relative temperature. To convert these relative temperatures to absolute values, the temperature of multiple targets (painted aluminum sheets) was measured during each UAV flight. By correlating these measured temperatures with corresponding pixel values in the thermal orthomosaic, I fitted a linear regression model to convert relative temperatures to absolute temperatures.
Similar to the canopy height analysis, the plot masks were applied to isolate individual plots and excluded soil pixels using the CNN-derived canopy masks. The average pixel value within each masked thermal image represented the average canopy temperature for each plot at each image acquisition date.
By combining canopy coverage, height, and thermal data, a more comprehensive understanding of crop health and development can be gained. For example:
The expanded pipeline, incorporating height and thermal data, provides a powerful tool for plant scientists and agronomists. By leveraging the capabilities of drone technology and deep learning, valuable insights into crop health, growth, and yield potential could be gained.