A deep dive into the process of building a custom hardware and software...
The Promise: Seeing the Unseeable with HSI
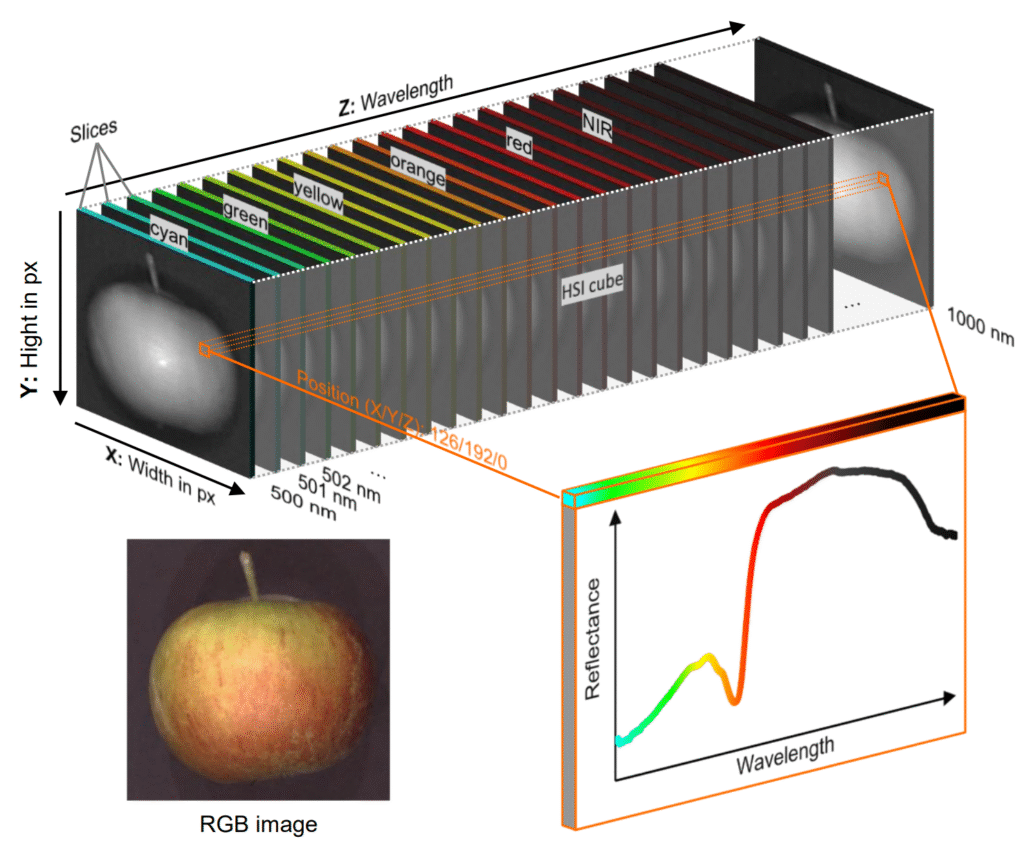
Imagine a standard photograph. Each pixel has three color values: red, green, and blue (RGB). This is perfect for capturing the world as our eyes see it. Now, imagine that for every single pixel, instead of just three values, you have hundreds, each representing a specific wavelength of light, many of which are outside the visible spectrum.
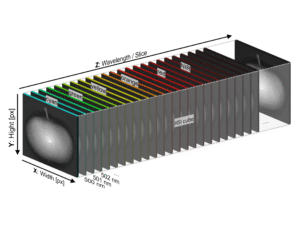
This is the power of Hyperspectral Imaging (HSI). This technique provides a detailed reflectance spectrum for every point on an object, allowing us to investigate subtle variations in its chemical and physical properties. This data is often visualized as a three-dimensional “HSI cube,” with two spatial dimensions (width and height) and a third spectral dimension (wavelength).
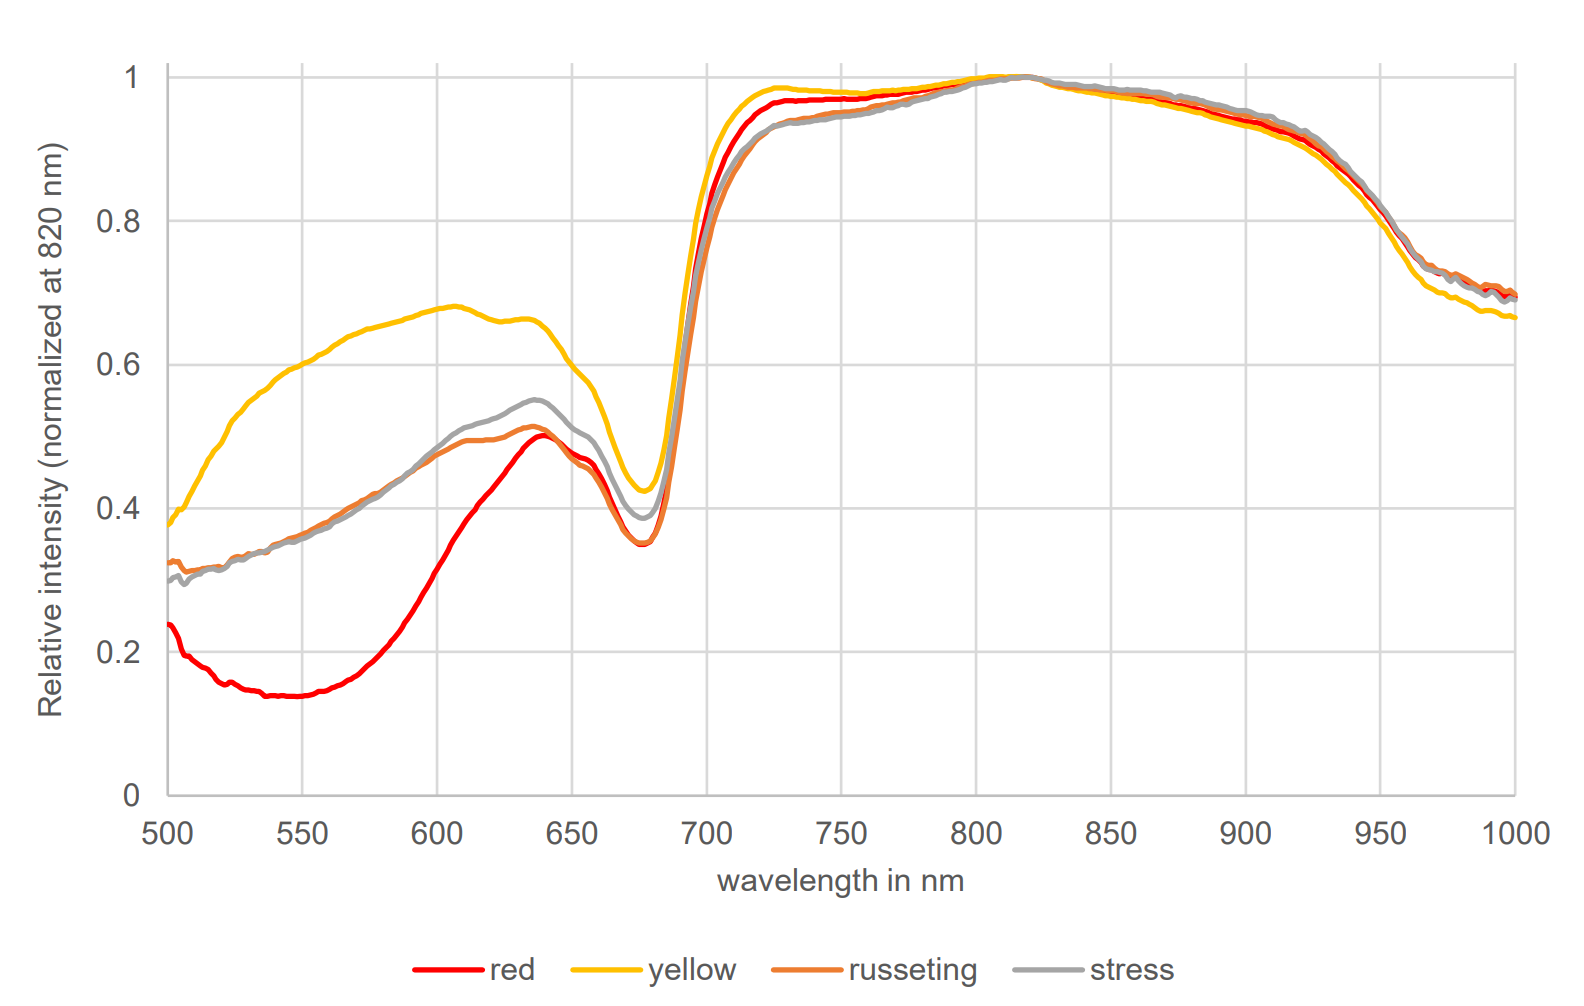
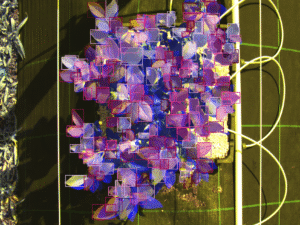
In plant sciences, this technology is incredibly promising. By analyzing this detailed spectral data, scientists can assess plant health, water content, nutrient concentrations, and even identify different species. Putting this powerful technology to the test on a common fruit like an apple yielded fascinating results. By analyzing the unique spectral ‘fingerprint’ from different areas—like healthy red skin, yellow skin, and patches with surface defects—it became clear that each surface had its own distinct signature. This demonstrated that, in theory, the necessary information to distinguish these surfaces was present in the hyperspectral data.
The Challenge: Drowning in Data and Complexity
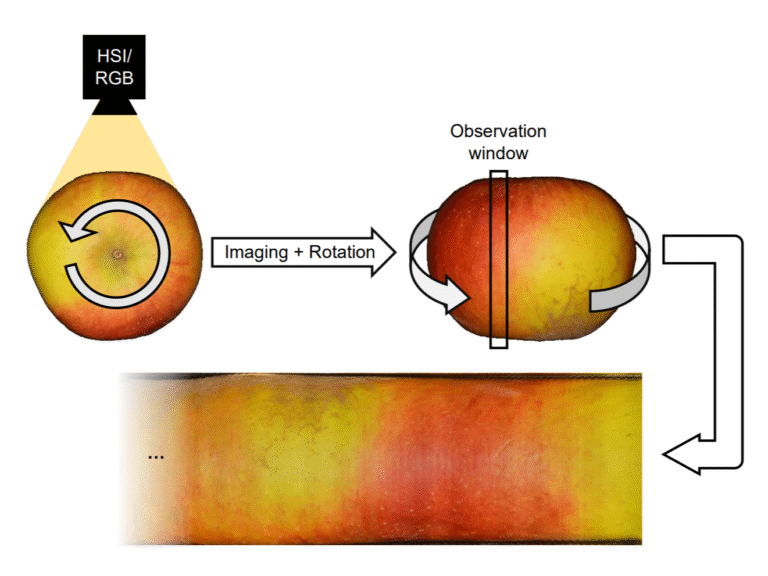
While HSI provides a wealth of information, its advantages come at a significant cost in complexity and practicality. To see this firsthand, I undertook a project aimed at quantifying apple russeting—a common surface defect characterized by a rough, brownish texture on the fruit’s skin.
The first and most immediate challenge I faced was the sheer volume of data. To capture the apple’s entire surface, it was imaged hundreds of times as it turned, with each image capturing hundreds of light wavelengths. This process for a single apple generated over 30 gigabytes of data. Processing these massive datasets requires significant computing power and time.
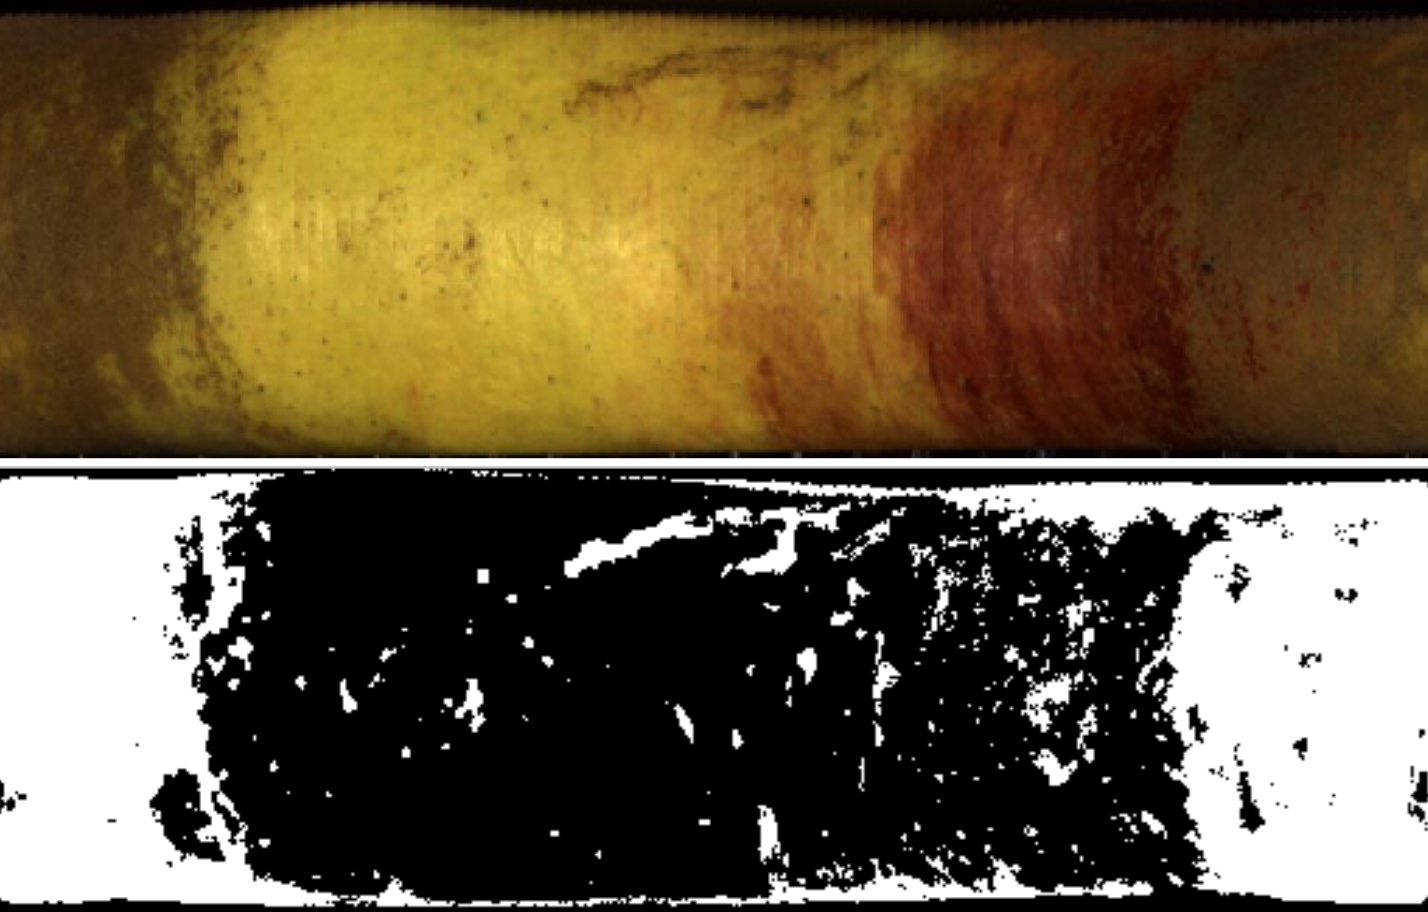
Beyond data storage, the analysis itself presents major hurdles. Simple analytical methods, such as calculating the ratio between two different wavelengths to highlight differences, proved insufficient. The results failed to create a clear, visual separation between russeted and non-russeted areas.
This necessitated the use of more advanced, “complex analysis” techniques:
Principal Component Analysis (PCA): This is a statistical method used to reduce the dimensionality of the HSI cube. It condenses the most important information from hundreds of spectral bands into a few “principal components.”
Machine Learning Algorithms (MLA): Once the data is simplified by PCA, a machine learning model can be trained to classify the pixels into categories like ‘Russeting’, ‘Apple’, and ‘Background’.
While these methods could segment a single apple with reasonable accuracy, a critical flaw emerged: the models were not transferable. The unique spectral signature of each individual apple meant that a model carefully trained on one fruit could not be reliably used to analyze another. This lack of transferability is a major drawback for any application aiming for automation and scalability. Every single apple would require its own supervised training process, defeating the purpose of an automated system.
The Surprise: Why Simpler RGB Imaging Was Superior
Given the limitations of the HSI approach, the investigation turned to a much simpler technology: standard RGB imaging, like that from a DSLR camera. The goal was to see if a machine learning algorithm, trained directly on these much simpler images, could effectively quantify the russeting.
The results were striking. The combination of RGB imaging and a well-trained machine learning algorithm (the ‘Trainable Weka Segmentation’ tool in Fiji) proved to be more robust, more accurate, and more transferable than any of the HSI-based methods.
Why was the simpler method better? The answer likely lies in the specific wavelengths of light. The HSI system used was most effective between 550 nm and 950 nm. However, the spectral analysis suggests that the most critical information for distinguishing russeting is found between 400 nm and 550 nm—a range that is well-captured by the blue and green sensors in a standard RGB camera but was at the very edge of the HSI system’s capabilities.
Conclusion: The Right Tool for the Job
The journey to quantify apple russeting offers a crucial lesson in technical problem-solving. Hyperspectral imaging is an undeniably powerful tool with the potential to unlock incredible insights across many scientific fields. However, it is not a universal solution. Its complexity, cost, and data intensity can be significant drawbacks.
In this case, the project demonstrated that a more accessible, less complex technology—RGB imaging—when paired with modern, sophisticated software like a machine learning classifier, delivered a superior outcome. It provided a scalable, transferable, and highly accurate solution, proving that sometimes the best approach isn’t the one with the most data, but the one that captures the right data.

Why You Should Go Abroad in Your Studies
I thought I spoke English until a bus driver in Cork threw me...
PhenoSelect: Training a Neural Network Because I Refuse to Click on 100,000 Leaves
An introduction to PhenoSelect, an open-source deep learning pipeline designed to automate leaf...

How to Image a Whole Apple
A deep dive into the process of building a custom hardware and software...
Beyond the Naked Eye OR Why More Data Isn’t Always Better
An exploration into how hyperspectral imaging and machine learning can be used to...